How to Look like a Phase Alignment Wizard
I’m going to show you how to quickly estimate alignment delay values in your head, which is a hell of a party trick if you’re at… a system optimization party?
This might seem mathy, but it’s not. If you passed middle school math, you can handle this.
We’re going to look at the delay needed to align two subwoofers as if we’re building an endfire array. I’m using Meyer’s VLFC as an example because it’s a “sub”subwoofer – it is designed to fill in the the octave below a normal sub (13 – 30 Hz) and so arraying these things means the spacings and timings have to get shifted quite a bit due to the much longer wavelengths involved. So you can’t rely on having memorized the normal range of spacing and delay values. You’re stuck with me until the end. 😀
Just so you can picture what’s going on here, we’ve got two boxes spaced by some distance, with the mic out front. The goal is to delay the front box so it fires as the energy from the rear box is passing it.
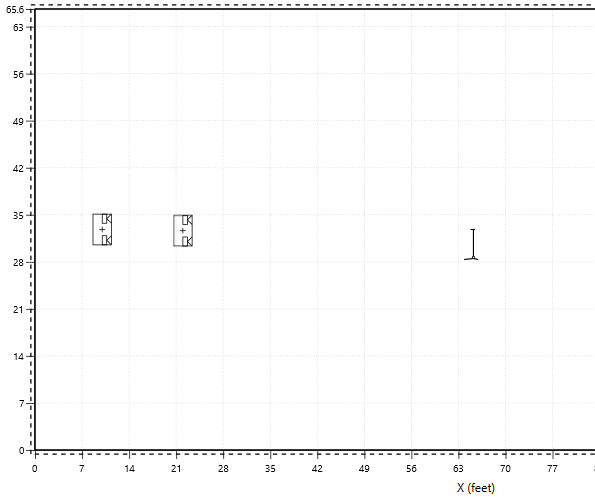
Now, forget I showed you that. You could rough in the delay based on the physical spacing in the image, but we can get all the information we need from the analzyer, and that’s the name of the game here.
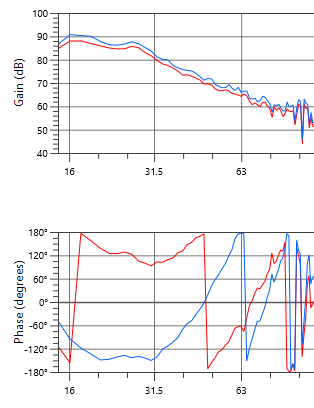
Here are the responses of the two boxes according to MAPP XT:
So the questions we need to answer are these:
- Which box gets delayed (red or blue)?
- How much delay do we need?
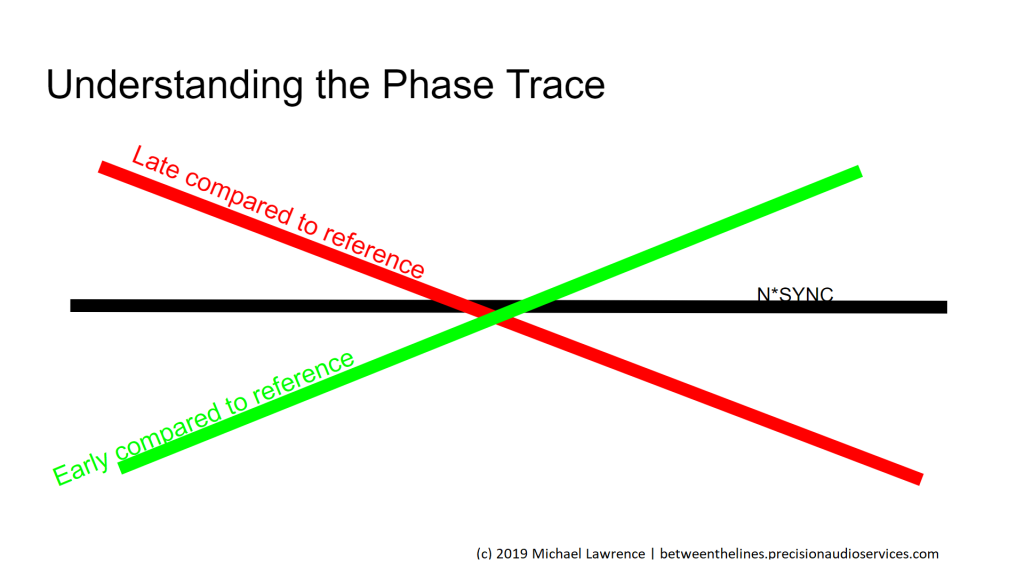
Looking at the magnitude trace (top) we see the blue is higher than the red. This means louder, which means closer to the mic. The mic is in front, so blue is the front box. Intuitively, now, we know that blue gets the delay. But we can also get this information from the phase trace alone. The very first post in this series dealt with understanding the phase trace, but we can get all we need to know from this graphic:
-
Flat phase trace – energy arriving in time with analyzer reference signal.
-
Trace sloping down left to right – energy arriving late.
-
Trace slopes up left to right, energy arriving early.
-
Steeper slope means more time offset.
So armed with this knowledge let’s look again at the MAPP phase trace.
In the center of the image, around 25 Hz, the blue trace is trending flat (on time) while the red trace is tilting down left to right (late). So red box is the rear box, arriving later.
I picked this frequency range because it’s easiest to see, but it works anywhere.
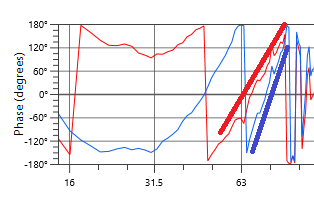
Up here, they’re both sloped up from left to right (arriving early), but the blue trace is a steeper slope (arriving earlier). So that gives us the same information: blue box is getting to the mic first, then the red box.
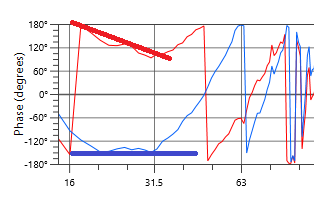
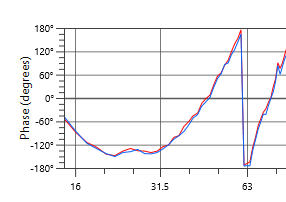
For the masochists, you can even do this down below 16 Hz if you like:

It’s much harder to see, but down here, both boxes are sloping down left to right (late) but the red trace is a bit steeper (later). So again, it’s farther away.
This gets easier with practice. So now we’ve answered the first question: which box gets the delay. Blue.
The next bit is “how much.”
If we were looking at a main/sub alignment, we’d only care about the phase offset around crossover frequency, but this is a “full range” summation between two identical boxes with a linear time offset between them, so we can read it anywhere we want and get the same answer. Here’s the easiest one:
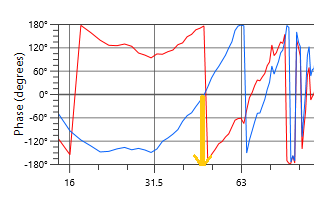
The blue trace is crossing zero as the red trace is wrapping up from 180°. That’s a half a cycle offset at just below 50 Hz.
Period of 50 Hz is 20 ms, a half cycle is 10 ms, and we’re just below that in frequency so let’s so with 11ms.
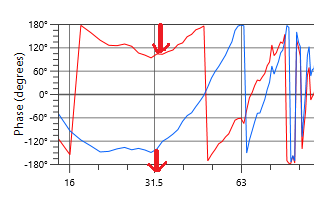
Perfect! But we can’t always count on it being so simple. Let’s pull the same number from another spot on the trace:
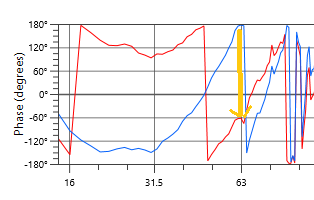
Delaying a box will tilt the phase trace down (we’re making it later) and here we need to tilt it down by 180+60° = 240° which is two thirds of a cycle. At 63 Hz, a cycle is 16 ms, so two thirds of that is 10.7 ms. Sixteen is tough to divide by three mentally so I’d say two thirds of fifteen = 10 ms and you’re still right in the ballpark.
Don’t fall into this trap though: it’s very easy to look at the difference between the two curves around 31 Hz and use that for your math.
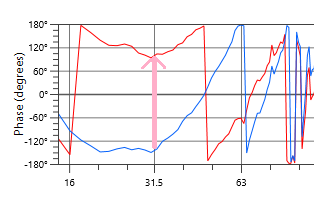
Don’t do this! Delay will push the blue trace down, not up, so we’re measuring the wrong way. Gotta go this way:
Push down off the bottom and wrap around the top. Measured that way, it’s about 120°, or a third of a cycle. At 31 Hz (32 ms) a third of a cycle is 11 ms.
(MAPP doesn’t allow a lot of flexibility in how you view the data – it’s not really meant for that – but most modern analyzers will allow you to “scroll” the phase readout so you can view it in the center of the screen without the wrap.)
This might seem a little draconian – and typing it out feels like that to me, as well – but if you practice this, you can usually generate an approximate delay value in a few seconds.
Not likely to replace “playing Wonderwall on the guitar” as a surefire way to pickup girls at parties, though.