SPL and Exposure data from nine shows I worked recently – here’s what I’ve learned from that.
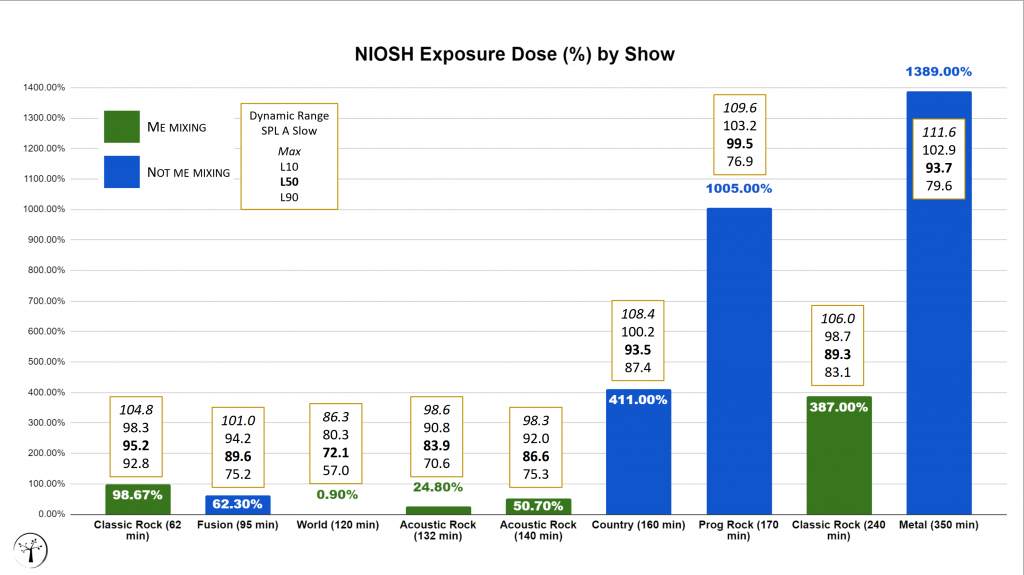
This chart shows NIOSH exposure dose data for nine live music events I worked on in the last few months, sorted by performance duration (longer performances on the right). The data is stated in percent dose, with 100% representing the full recommended exposure limit for the day.
Green bars indicate shows that I mixed (I had control of the level), while blue bars indicate shows mixed by another individual (I had no control over the level).
The genre of the event, along with the length in minutes, appears below each bar. This is data (air pressure modulation) that anyone in attendance could have recorded using a logging handheld meter, dosimeter, or calibrated mobile device / smart watch, and is therefore not privileged or confidential. However, I’ve chosen to exclude the artist names, instead listing only the genre for each show. The 350 minute metal show was a touring bill with 5 bands, hence the length of the event. The 240 minute classic rock show was a multi-act show in a small club, and the 170 minute progressive rock was a well-known prog rock band that played a single long set.
Inside the gold boxes is dynamic range information for each event. Although A-weighted, C-weighted, and Z-weighted data was logged for each event, I focus here on A-weighted data (specifically SPL A Slow) since it forms the basis of the Exposure calculations.
The top (italicized) value, Max, indicates the Max SPL A Slow value logged during the event. The second value down, L10, which represents the highest 10% of all the readings recorded – in other words, 90% of all individual readings taken were below this level. The third (bolded) value down, L50, is the median level – half of the values recorded were less than or equal to this value, and half were higher. The fourth value down, L90, is the level that was exceeded 90% of the time and is generally regarded as a useful indicator of background noise levels. Taken together, these statistics give us information about the dynamic range of the event.
I have included these because they illustrate an important concept: hearing damage is not just about “how loud” but also “how long.” The metal show, despite representing a massive exposure dose for the audience, wasn’t as “loud” on average as some of the other, far less damaging performances. The length of the event means that even at a reasonable level, it would represent an unsafe exposure. (For a show that length to clock in at 100% dose, it would have to be 82.3 dBA.)
Here are some of my personal takeaways:
-
As soon as I mention to friends and family that I have been studying SPL monitoring, they immediately want to know a single-number value for “how loud is too loud,” and unfortunately the answer is not that simple. The best answer I have for a layman right now is that we have to look at “how loud” and “how long.” This avoids getting into the muck of weighting curves and time integration at family events. 😀
-
I tend to work in production environments and with music genres that seem to have an expectation for generally lower show levels overall. However, even if it’s a traditionally “loud” genre, pulling things back by a few dB makes a world of a difference, and the productions I have run at lower levels have received positive feedback from the concertgoers to management. People expect loud concerts these days but in my experience they seem to be pleasantly surprised when they can enjoy the event at a comfortable level.
-
“Comfortable level” is pretty subjective based on genre and individual (and their level of hearing damage!) so you can’t please everyone. It’s a matter of opinion, but we have a lot of information now on what is objectively unsafe, and I would argue that we have a professional obligation to understand these concepts and be as responsible as possible towards our audiences. There are also a lot of factors here, both objective (subwoofer level) and subjective (how recently a listener ate, flew on a plane, or consumed alcohol or drugs)
-
Shows are louder towards the front – and often significantly so. Even a proverbial minimum variance system that is only 6 dB louder in the front (and disregarding stage volume completely) means four times the exposure dose for the folks in the front rows. This is why some SPL regulations require the measurements to be taken from the loudest area accessible by the audience. As a concertgoer, it’s probably better to be a bit further back.
-
It only takes a 3 dB reduction to cut your exposure in half, so popping in plugs is a simple way to effectively protect yourself. If you’re not mixing, foamies offer maximum protection, but even musicians plugs can grant a substantial amount of protection.
-
Popping out the plugs for short periods to listen critically, and then reinserting them, is a great way to minimize exposure while remaining professionally effective. We (production staff) are at a much higher risk for noise-induced hearing loss because we are routinely exposed to these levels. According to NIOSH audiologist Dr. David Byrne, occasionally exceeding the REL dose (people who seldom attend concerts) is not necessarily presenting a significantly increased risk of hearing loss, but it is definitely possible to suffer permanent damage based on a single exposure event, and he also pointed out that we don’t know what the individual audience members have been exposed to already that day (operating a vacuum / lawn mower / working at a construction site, etc).
-
Therefore, rather than shooting for a specific exposure goal (“my show was only 99% tonight, so we’re safe”), it probably makes the most sense to strive for keeping it as low as possible in general.
This is an interesting journey so far and I’m still learning a lot about it, but there is a growing wave of consciousness about these issues and I expect to see increased regulation and legislation in the near future, which is why it’s important for us to understand these issues and be able to engage with the topic in a meaningful way.
Further reading from NIOSH [PDF]
One Reply to “SPL and Exposure data from nine shows I worked recently – here’s what I’ve learned from that.”