Consistency Improvements
When I was in high school, I was a member of the Cross Country team. What I found very appealing about that sport was that it wasn’t just about competition with other runners – it was also about competition with yourself – pushing yourself to always improve upon your best results. I feel some of the same spirit with recurring gigs – each time I work in the same venue, or with the same band, or with the same rig, I try to make some improvement over the last time.
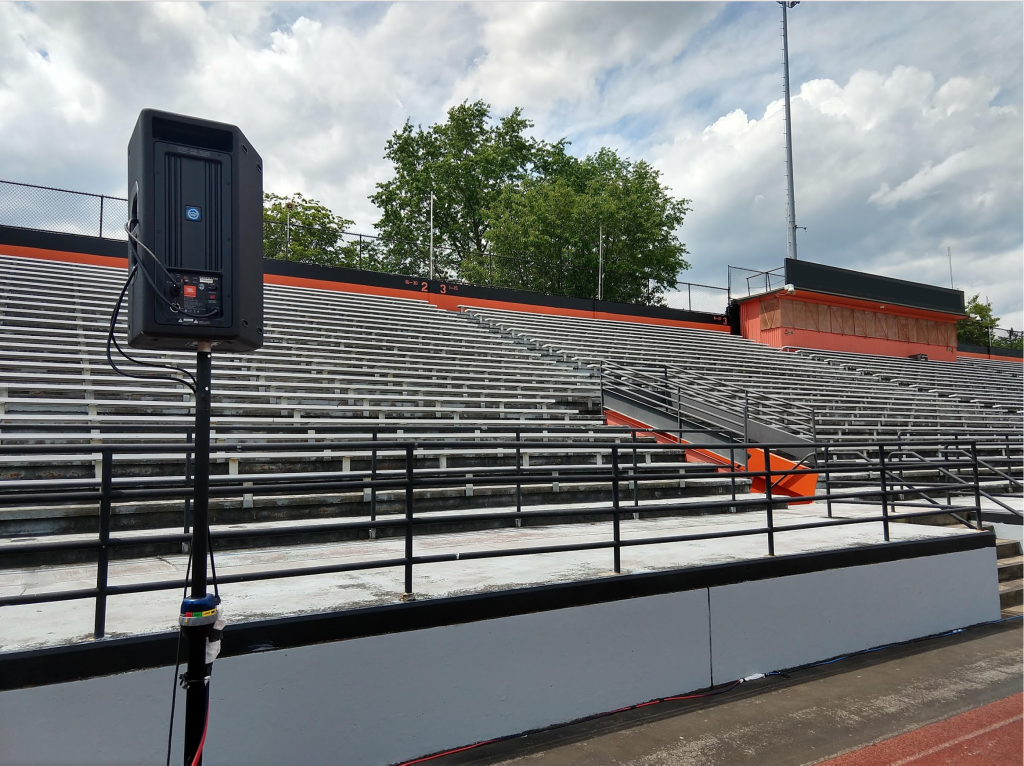
A year ago, I covered this grandstand for a local ceremony with an uncoupled line of point source boxes. (Why? ‘Cause you have to work with what you have.)
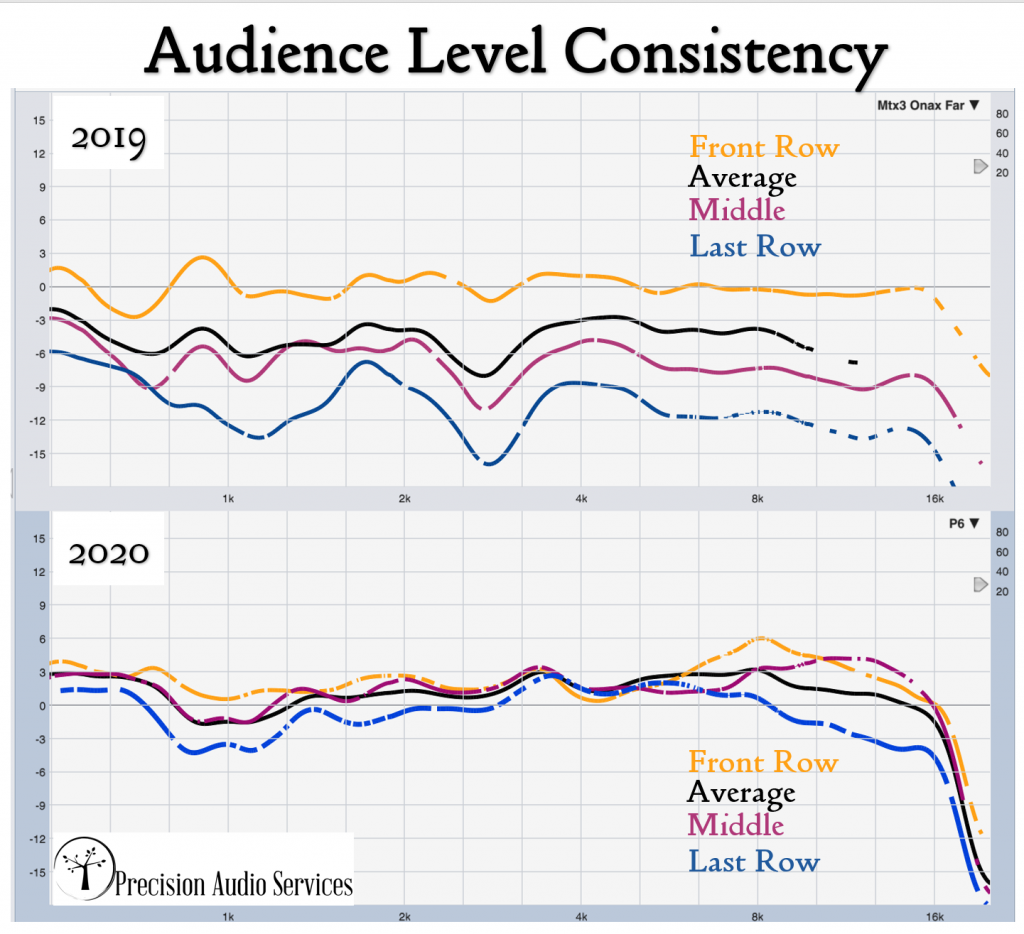
Although the intelligibility was fine, the low height relative to the seating area, coupled with the inability to tilt the boxes back and aim them at the rear of the seating area, meant that the front to back level variance was higher than I would have liked. Although it was quite windy, the measurements taken from on-axis Near (gold), Mid (red), and Far (blue) tell the story:
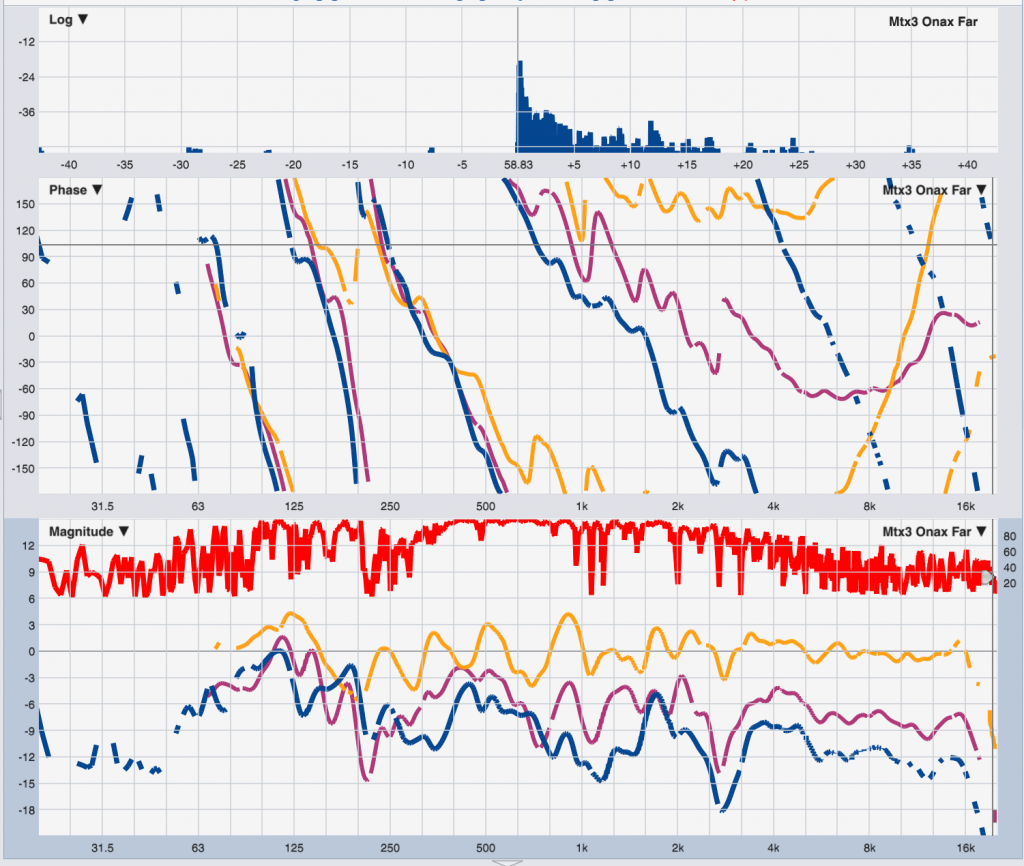
We have the wind to thank for the dip in coherence and inconsistent phase responses at HF. This data also provided an excellent ground bounce study, but that’s for another time.
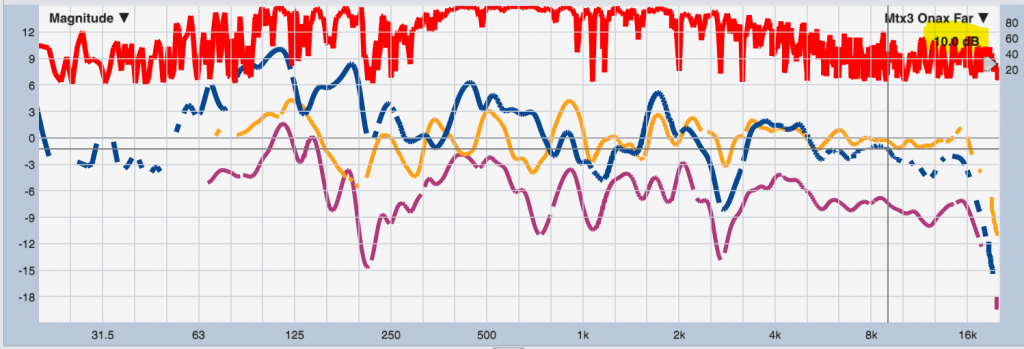
We can get a quick idea of what the front to back level variance is by selecting the Onax Far trace and adjusting its vertical offset (by using the dB +/- buttons or [Ctrl]+[+/-] in Smaart) until it sits on top of the Onax Near trace, and reading the offset value in the upper corner of the plot. Here: 10 dB in the 4 kHz region, which is of paramount important for public address situations.
Those traces can then be averaged and use as the basis for corrective EQ, however, we’re stuck with the level variance as a function of the geometry.
This year, we were able to replace the point source boxes with 3-box deployments of RCF HDL6-A elements, using their handy pole-mount rigging adapter. Lacking the exact dimensions of the seating area, I roughed in a quick Ease Focus model and decided to start with a frame height of 7 feet above ground, with a splay angle of 5° between the frame and box 1, 5° between boxes 1 and 2, and 3° between boxes 2 and 3. I showed this prediction to Nate, who would be mixing the event, and we decided it was a good starting point.
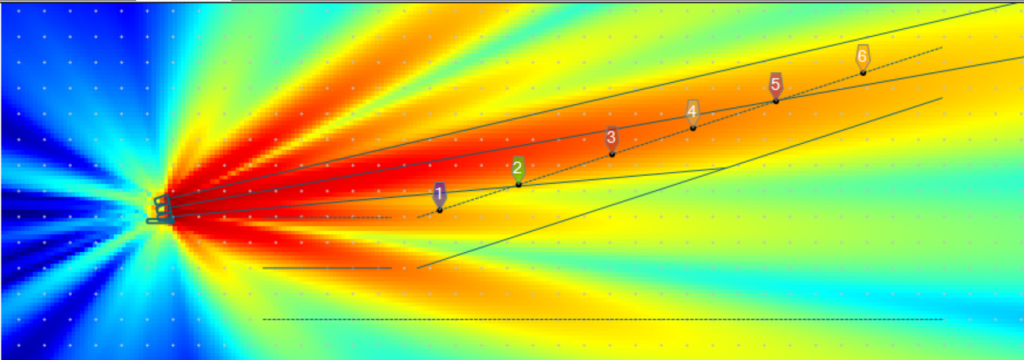
This allowed us to create a much more tightly focused beam in the high frequency coverage, angled back to better address the geometry of the seating area.
On show day, of course some changes were made to the deployment locations based on audience access points and sight lines, but what we ended up with was quite satisfactory.
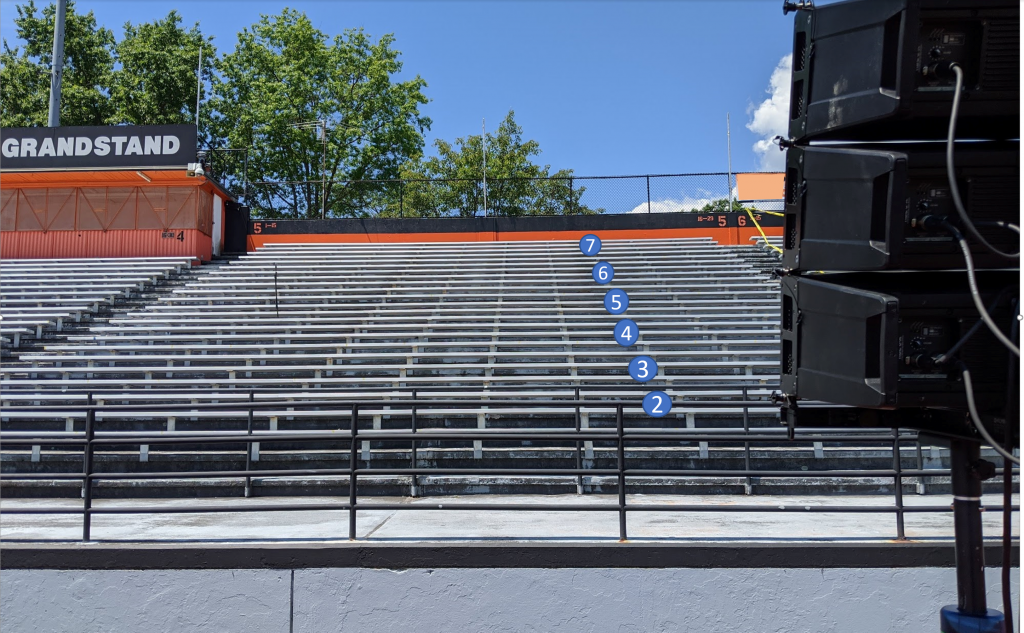
Here we see one of the four arrays that runs the length of the seating area, spaced so their coverage will converge around the first row of seats. We fired up the rig and took measurements at the locations marked in the photo above to study the front to back level variance of this deployment.
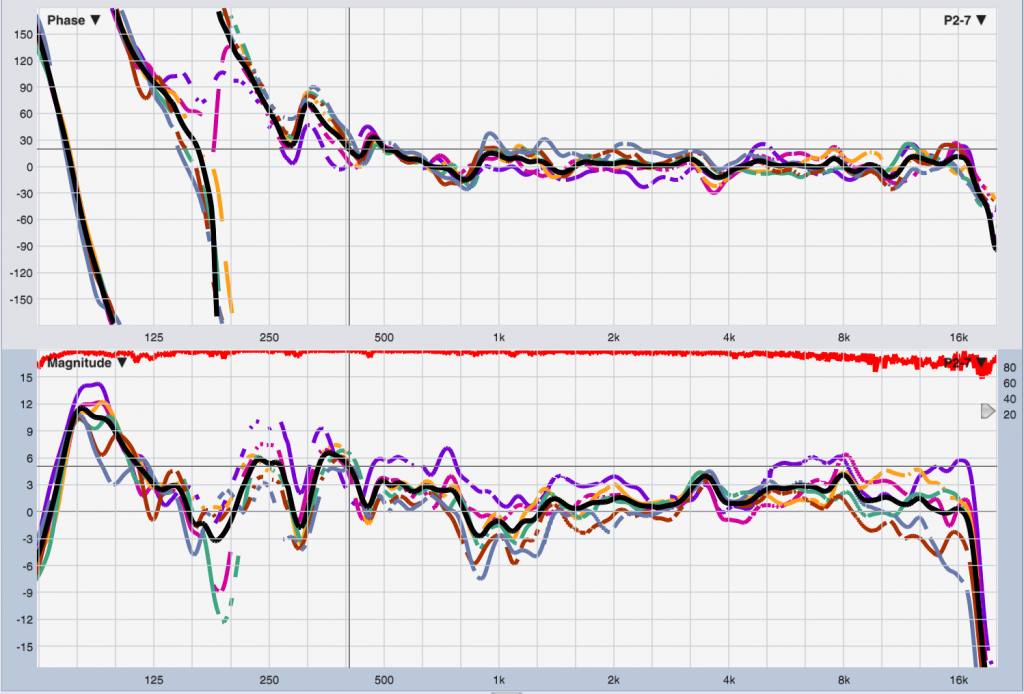
Here we see the “raw” response of the loudspeakers before any crossover filters, EQ or processing of any kind were introduced. In the low-mid region, we see the telltale signs of comb filtering from the bounce off the aluminum seating, a perfect example of something not to EQ. However, in the key intelligibility region from 1 kHz to about 6.3 kHz, the traces are extremely consistent, with level variance of all positions hanging within about 3 dB of the average (black). This is a giant leap forward in terms of audience uniformity, and gives the mixer a much higher level of confidence in consistent listening experience for the (distanced) attendees.
Any equalization applied at this point will be extremely effective due to the high spatial consistency of the coverage. And, I think, this sets a rather high bar for further improvement next year.
2 Replies to “Consistency Improvements”
Great article. However, the 2019 Plots show consistent tonality but a level drop. In comparison, the 2020 Plot Show all positions with a similar level at 4 kHz with tilts on either side. I would assume that this would not be exactly what makes for great overall EQ choice. It’s a compromise- Consistent tonality with level variance or inconsistent tonality with consistent level.
Hi Sunil –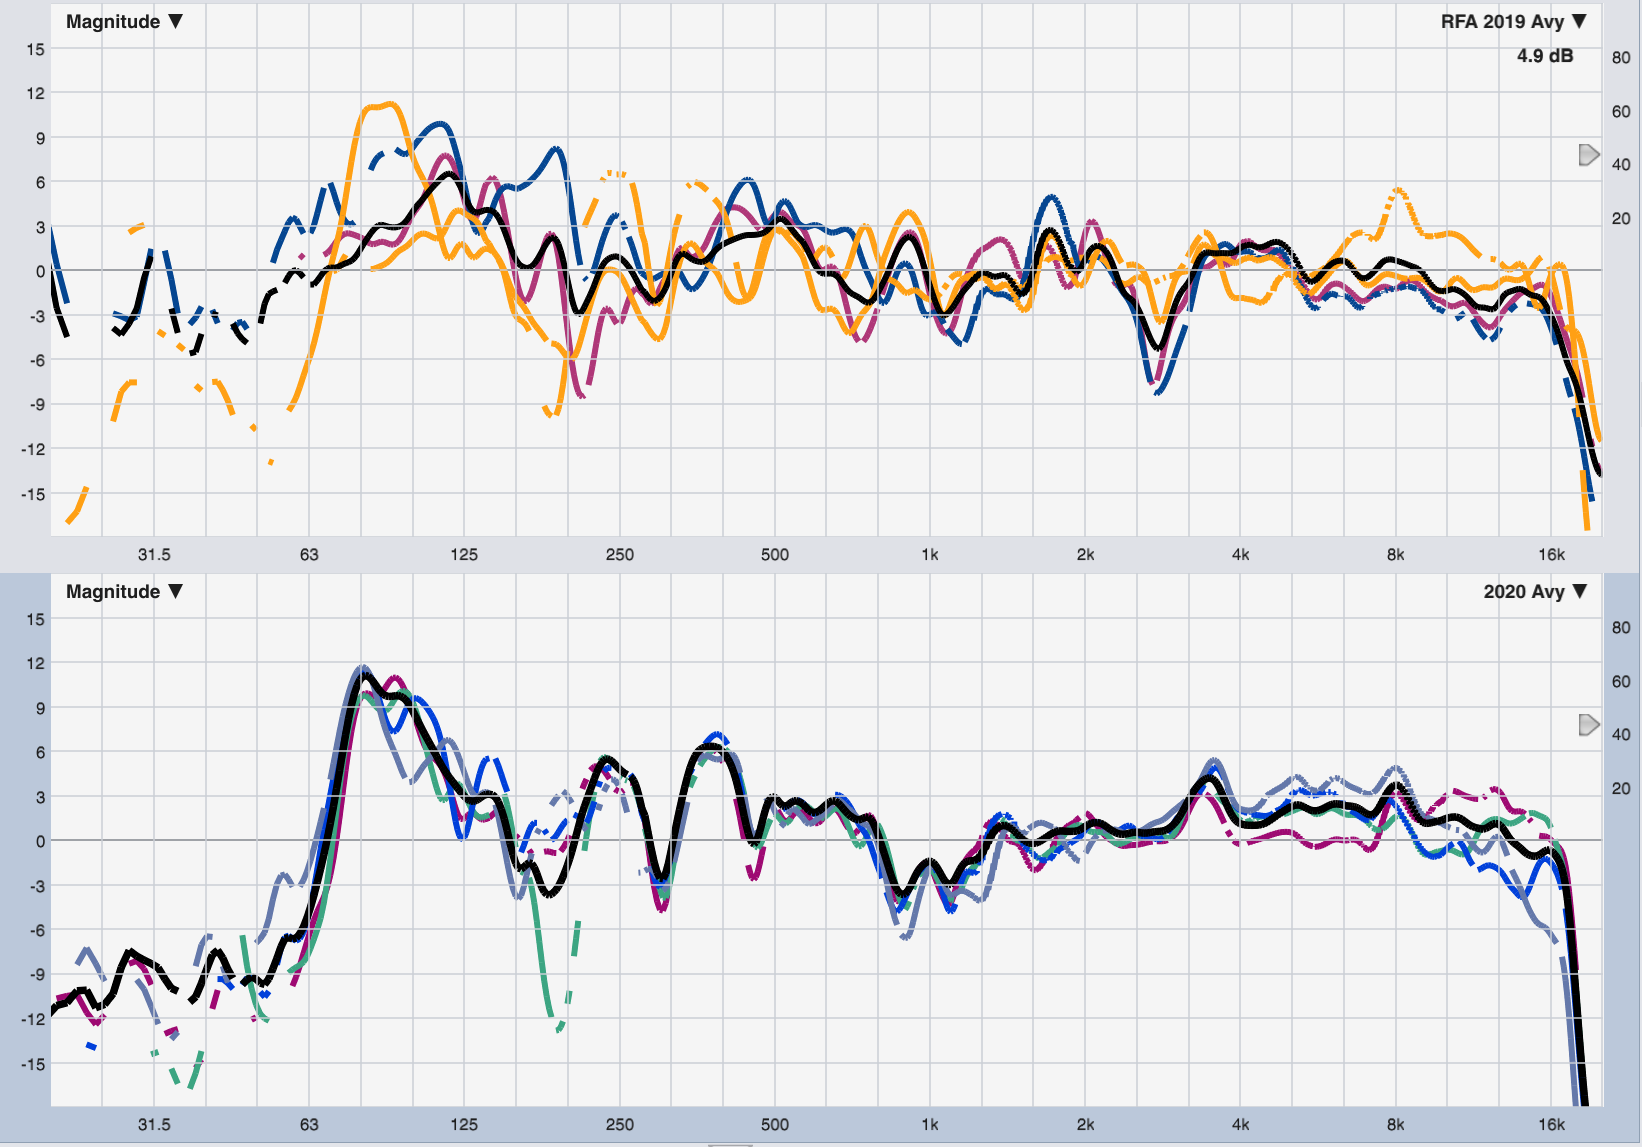
Thanks for reading, and for the comment! Looking at the level-normalized measurements from each year compared to their respective averages, to my eye the 2020 data all hangs closer to the average better than the 2019, and I’d say the 2020 rig is better in both level and spectral variance categories. Take a look (averages in black):